Production Monitoring Software: Complete Guide to Features, Benefits, ROI & Implementation (2026)
Learn how automated production tracking unlocks actionable shopfloor insights, slashes downtime, and maximizes plant profitability.
Dalnex Team
Industrial Automation & Operations Engineers
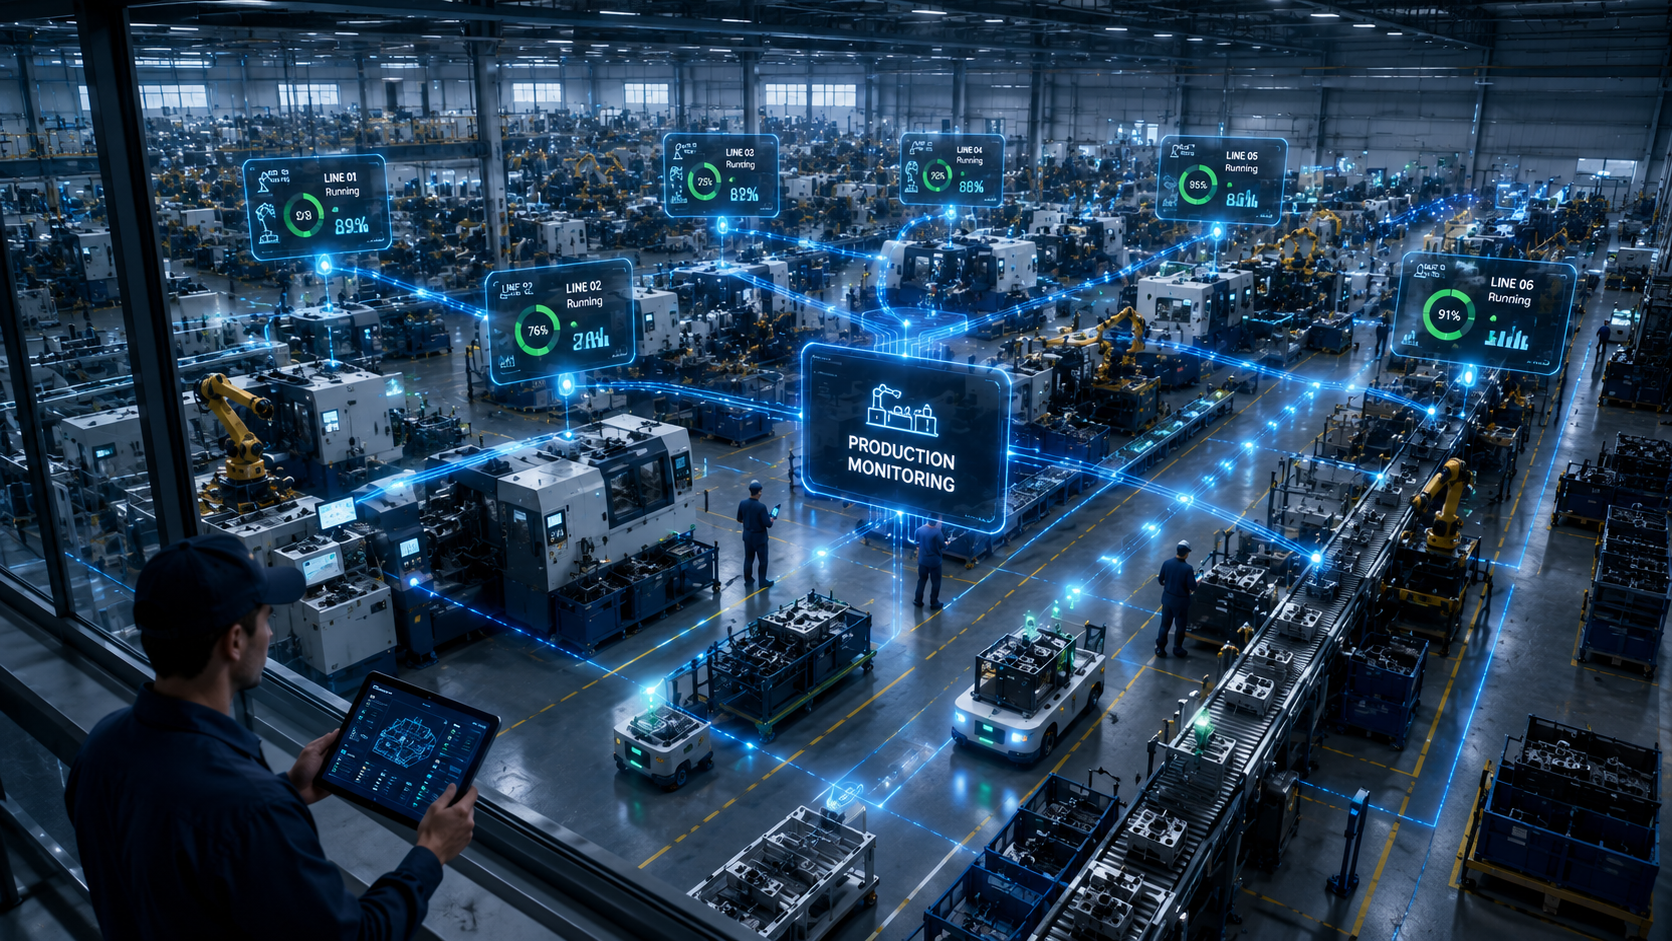
In today's competitive manufacturing landscape, every minute of machine downtime, every production delay, and every quality issue directly impacts profitability. Yet many factories still rely on manual production reports, spreadsheets, or delayed shift updates, making it difficult to identify issues before they become costly problems.
Production Monitoring Software enables manufacturers to monitor machines, production lines, and operators in real time. By collecting live data from PLCs, sensors, and Industrial IoT (IIoT) devices, it provides instant visibility into production output, machine status, downtime, cycle times, quality metrics, and Overall Equipment Effectiveness (OEE).
Instead of reacting after a shift ends, manufacturers can make informed decisions as production happens. This helps improve productivity, reduce downtime, optimize resource utilization, and support continuous improvement initiatives.
Whether you're in automotive, plastics, injection molding, packaging, pharmaceuticals, or FMCG, Production Monitoring Software has become a key enabler of Industry 4.0 and smart manufacturing.
What is Production Monitoring Software?
Production Monitoring Software is a digital platform that collects, analyzes, and visualizes production data from machines, equipment, and shop floor operations in real time.
- Machine status (Running, Idle, Breakdown, Maintenance, Setup)
- Live production counts and piece rates
- Unplanned downtime and micro-stoppages
- Cycle times vs ideal engineered cycle times
- Real-time OEE (Availability, Performance, Quality)
- Rejection rates, defects, and scrap counts
- Shift-by-shift performance benchmarking
- Operator and cell productivity
Why Do Manufacturers Need Production Monitoring Software?
Without accurate real-time data, production managers often discover bottlenecks and output deficits only after production losses have already occurred:
- Lack of real-time production visibility across shifts
- Frequent and unrecorded machine breakdowns
- Manual, time-consuming production reporting on paper
- Inaccurate and inconsistent production data entry
- Low and unknown machine utilization rates
- High scrap and rejection rates caught late in the process
- Delayed operational decisions and missed delivery dates
- Suboptimal production scheduling and machine allocations
How Production Monitoring Software Works
A four-step data cycle from physical equipment to real-time shop floor intelligence
Data Collection
Telemetry is automatically gathered from PLCs, CNC machines, injection molding machines, sensors, IoT gateways, barcode scanners, and operator touch terminals.
Data Processing & Aggregation
The edge and cloud engines process raw machine signals into standardized metrics: production count, cycle time, machine status, downtime intervals, energy consumption, and quality logs.
Visualization & Real-Time Dashboards
Live production dashboards display machine status, OEE dials, target vs. actual pacemakers, shift progress, and downtime Pareto charts across any screen or device.
Alerts, Notifications & Automated Reports
Instant notifications alert maintenance and supervisors to machine stops, low output, high rejection rates, or process drift via dashboards, SMS, email, and messaging apps.
Key Features of Modern Production Monitoring Software
- Real-Time Machine Monitoring: Track every machine’s exact operational status—Running, Idle, Breakdown, Maintenance, or Setup—second by second.
- Live Production Dashboard: Monitor machine output, pace vs target, utilization, and downtime across cells, lines, shifts, and multiple plants.
- Automated OEE Calculation: Continuously compute Availability, Performance, and Quality metrics to identify hidden production losses.
- Downtime Analysis: Automatically record breakdown durations, planned vs unplanned downtime, changeover times, and classify stoppage reason codes.
- Shift Performance Analysis: Compare day vs night shift output, operator efficiency, and machine consistency to replicate best practices.
- Production Target Tracking: Compare planned work orders against actual completed pieces in real time to prevent schedule slippage.
- Historical Analytics: Deep-dive into historical data trends across days, weeks, or quarters to pinpoint which machines or tools cause recurring bottlenecks.
- Automated Alerts & Push Triggers: Receive instant notifications for machine stoppages, excessive cycle times, reject spikes, or missed hourly targets.
Production Monitoring Software vs Manual Production Monitoring
| Manual Paper-Based Monitoring | Production Monitoring Software |
|---|---|
| Paper log sheets & clipboards | Automated Real-Time Data Collection |
| Delayed end-of-shift reports | Instant Live Dashboards & Telemetry |
| Subject to human error & estimation | 100% Accurate Machine-Level Data |
| Reactive, post-shift firefighting | Proactive, Real-Time Problem Solving |
| Limited, fragmented floor visibility | Complete End-to-End Plant Visibility |
| Manual, tedious formula calculations | Automated KPIs, OEE & Trend Analytics |
| Difficult, imprecise OEE tracking | Live, Standardized OEE Dashboards |
Quantifiable Benefits for Plant Operations
- Increased Productivity: Identify line bottlenecks immediately and maximize hourly piece output.
- Reduced Downtime: Automated alerts enable rapid technician response, cutting mean time to repair (MTTR).
- Improved OEE: Real-time visibility across availability, performance, and quality drives continuous efficiency gains.
- Better Decision-Making: Plant managers rely on objective machine facts rather than subjective recollections.
- Enhanced Product Quality: Early detection of defect patterns reduces scrap and customer quality escapes.
- Higher Machine Utilization: Identify underutilized assets to balance production schedules effectively.
- Accurate Shift Reporting: Automatic shift logs save supervisor hours and ensure foolproof compliance.
- Lower Manufacturing Overhead: Less downtime, reduced scrap, and optimized cycle times translate directly to bottom-line profit.
Industries That Benefit Most
- Automotive & Tier Parts Suppliers
- Plastic Injection & Blow Molding Facilities
- Die Casting & CNC Machining Centers
- Packaging & Bottling Operations
- Food & Beverage Processing
- Pharmaceuticals & Medical Devices
- Electronics & Precision Components
- Sheet Metal & Fabrication Industries
- Textile & Fiber Manufacturing
- High-Speed FMCG Packaging
How to Successfully Implement Production Monitoring Software
Identify Business Objectives
Set clear targets: e.g., lift OEE by 15%, cut unplanned downtime by 30%, or eliminate manual paper logs within 60 days.
Connect Machines via Gateways or PLC Integration
Deploy industrial edge hardware or software connectors to capture digital and analog signals from controllers and sensors.
Configure Production Parameters & Part Libraries
Input standard cycle times, scrap thresholds, part numbers, tooling data, and shift rosters into the platform.
Create Role-Tailored Dashboards
Deploy line-side pacemaker displays for operators, supervisory control consoles, and executive mobile dashboards.
Train Employees & Standardize Reason Codes
Equip floor operators with one-touch downtime code selection to ensure consistent stoppage categorization.
Review Reports & Implement Continuous Improvement
Conduct daily 10-minute stand-up meetings around live dashboard metrics to eliminate recurring root-cause losses.
Measuring Return on Investment (ROI)
Manufacturers quantify the business return of production monitoring through concrete financial metrics:
- Increased Production Output: Producing more sellable units within scheduled shift hours.
- Reduced Machine Downtime: Recovering valuable production hours by reducing breakdown and setup delays.
- Improved OEE Scores: Moving from average 60% levels toward world-class 85% benchmarks.
- Lower Scrap & Rejection Rates: Slashing material waste through immediate process drift warnings.
- Reduced Maintenance Costs: Shifting from reactive emergency repairs to planned condition-based interventions.
- Enhanced On-Time Delivery: Predictable cycle times and fewer delays boost customer delivery ratings.
ROI Impact Note
In high-volume discrete manufacturing, even a 1% to 3% improvement in OEE typically generates tens or hundreds of thousands of dollars in recovered capacity each year without purchasing new machines.
Frequently Asked Questions
Ready to Digitize Your Factory?
If you want to gain real-time production visibility, improve OEE, reduce downtime, and make smarter manufacturing decisions, FactOS by Dalnex provides a comprehensive production monitoring solution designed for modern factories.
Experience Dalnex Smart Manufacturing
Connect your machines, eliminate blind spots, and achieve measurable OEE improvements in as little as 30 days with FactOS & VisionOS.
Related Manufacturing Guides
What is a Factory Operating System? Meet FactOS by Dalnex – The Complete Guide for Smart Manufacturers (2026)
Discover how a modern Factory Operating System connects machines, people, and processes to boost OEE and eliminate shopfloor downtime.
Read Guide Industrial IoTIndustrial IoT (IIoT) Platform Explained: Complete Guide to Smart Manufacturing & Industry 4.0 (2026)
Understand IIoT architecture, industrial protocols, edge computing, and how connected factory ecosystems empower predictive manufacturing.
Read Guide OEE & AnalyticsOverall Equipment Effectiveness (OEE): Complete Guide to Improving Manufacturing Performance (2026)
Master the OEE formula, identify the Six Big Losses, benchmark your plant against world-class standards, and drive continuous productivity.
Read Guide